Weather API - weatherMap - parameters
The individual forecast maps are widly configurable to match the desired look. Below you find a detailed description of all possible parameters and their use.
All parameters have standard values in case they are not specified. The order of the parameters has no influence. In this description the Parameters and their values are written in the camelCase format, but the parameters and their values are recocnized case insensitive by the API. An excepction is the value of the parameter "label" of corse ;-).
The parameters are described with the wind_stream maps but they are valid for all forecast maps.
Parameters "latRange" and "lonRange"
Parameter "var"
Standard value: "var" = "windStream"
Accepted values:
- windStream | GFS_WIND_10m | GFS_WIND_10m_Stream
- windBarb | GFS_WIND_10m_Barb
- windVector | GFS_WIND_10m_Vector
- gust | GFS_GUST_10m
- airTemperature | GFS_TMP_2m
- surfacePressure | GFS_PRMSL_msl
- cloudCover | GFS_TCDC_atm
- relativeHumidity | GFS_RH_2m
- precipitation | GFS_PRATE_0m
- significantWaveHeight | GFSWAVE_HTSGW_0m
- primaryWaveHeightDirection | GFSWAVE_HTSGW_DIRPW_0m
- primaryWavePeriod | GFSWAVE_PERPW_0m
- windWaveHeightDirection | GFSWAVE_WVHGT_WVDIR_0m
- windWavePeriod | GFSWAVE_WVPER_0m
- swellHeightDirection | GFSWAVE_SWELL_SWDIR_0m_1
- swellPeriod | GFSWAVE_SWPER_0m_1
- seaSurfaceCurrent | RTOFS_CURR_0m
- seaSurfaceTemperature | RTOFS_WTMP_0m
- seaIceCoverage | RTOFSICE_ICEC_0m
- seaIceThickness | RTOFSICE_ICETK_0m
The parameter "lat" (Latitude) and "lon" (Longitude) specify the position of the weather forecast in decimal degrees.
For example Abu Dhabi, UAE: lat=24.48411&lon=54.36870
Parameters "lat" and "lon"
Standard values: "lat" = 0, "lon" = 0
Accepted values: "lat" -90 to 90, "lon" -180 to 360
The parameter "lat" (Latitude) and "lon" (Longitude) specify the position of the weather forecast in decimal degrees.
For example Abu Dhabi, UAE: lat=24.48411&lon=54.36870
Parameters "latRange" and "lonRange"
Standard values: "latRange" = 10, "lonRange" = 14
Accepted values: "latRange" 4 to 180, "lonRange" 4 to 360
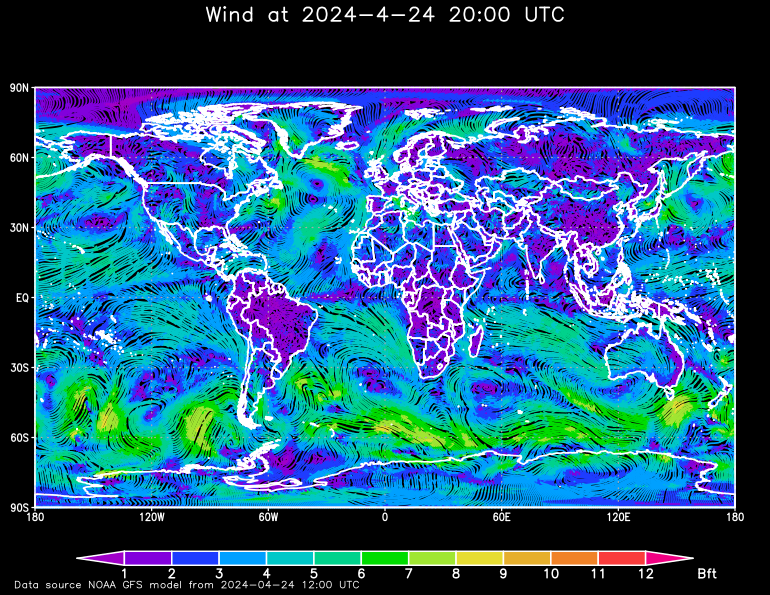
The parameters "latRange" (Latitude) and "lonRange" (Longitude) specify the range around the center of the forecast map in decimal degrees.
For example latRange=20, lonRange=28 and to compare latRange=180, lonRange=360:
Parameter "t" or "timestep"
Standard value: "t" | "timestep" = 0h
Accepted values:
- 0h to 72h in steps of 1h and 75h to 240h in steps of 3h
- 0 to 72 in steps of 1 and 75 to 240 in steps of 3
- Timestep in ISO 8601 format, e.g.: 2025-11-03T18:00:00Z
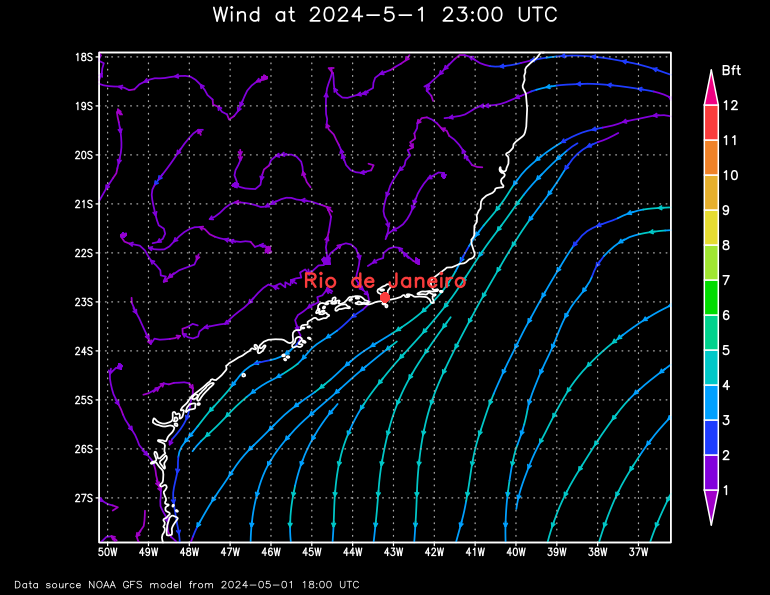
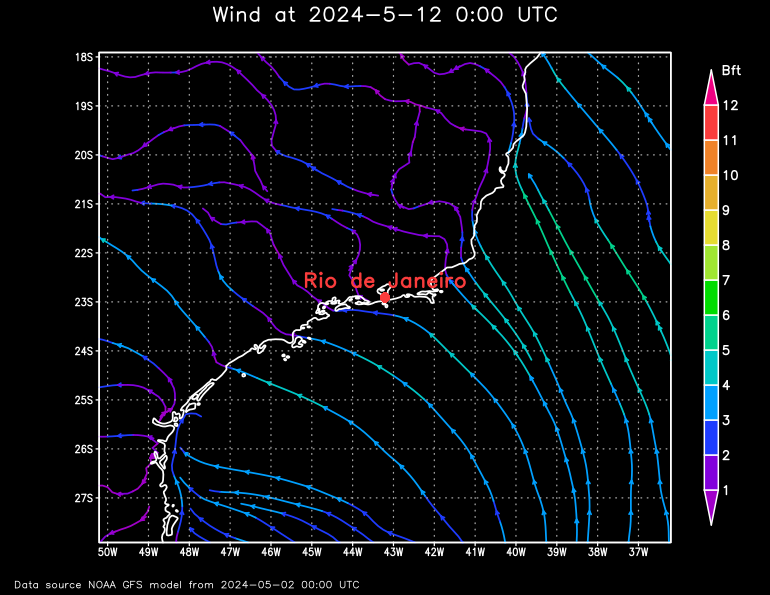
The parameter "t" | "timestep" specifiy the moment of the forecast in hours from (roughly) the actual time or the ISO 8601 timestamp. The forecast is actualized every 6 hours.
For example Rio de Janeiro, Brasilien:
Parameter "label"
Standard value: "label" = ""
Accepted values: All characters but not all special characters
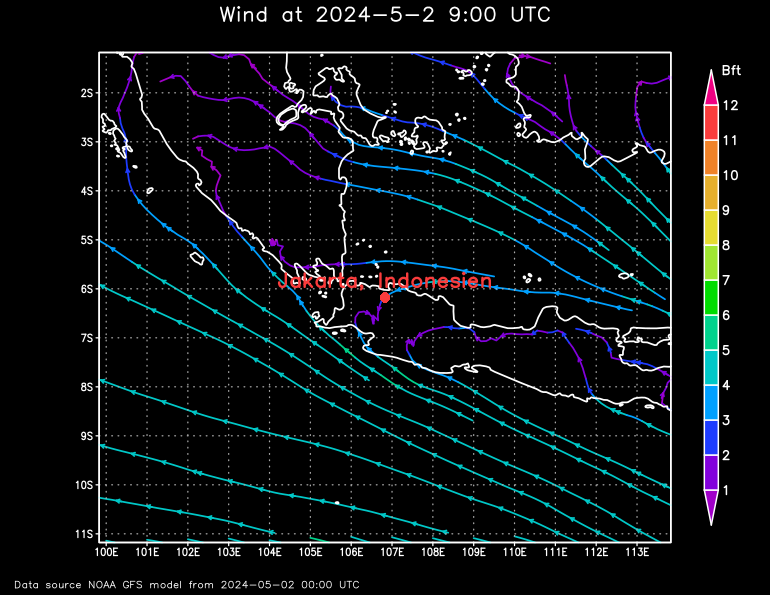
This parameter specifies the name of the location printed on the forecast map.
There are limitations: Umlauts (Ä,Ö,Ü,ä,ö,ü) and some special characters such as "ß" can not be displayed. Also the beginning and end of the line will be cut if the line exceeds the width of the meteogram. Just try it.
For example Jakarta, Indonesien:
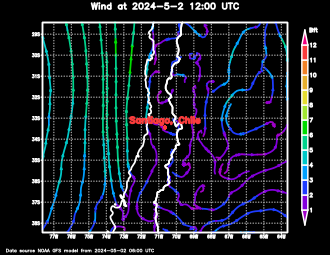
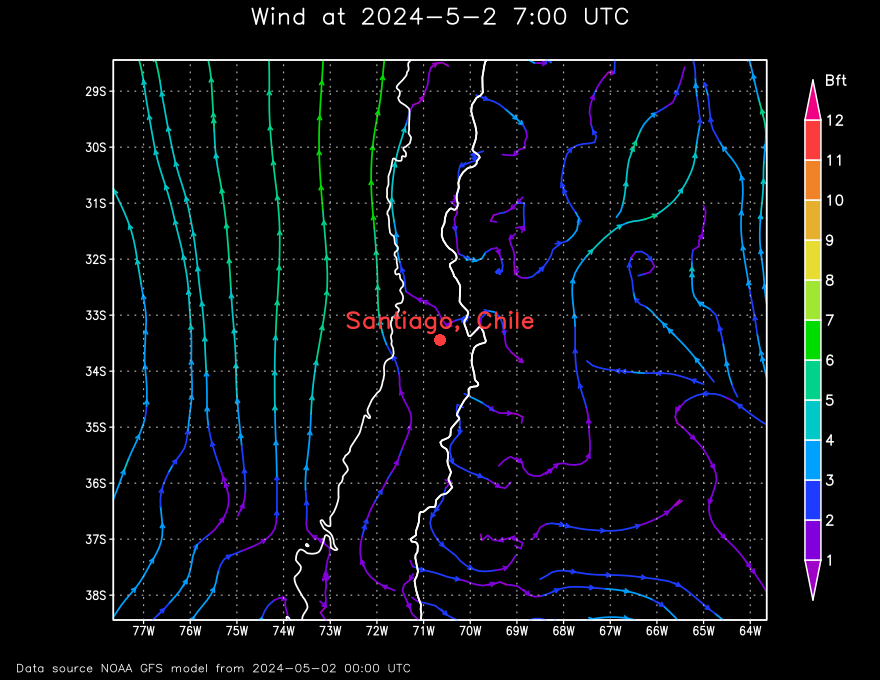
Parameters "nx" and "ny"
Standard values: "nx" = 770, "ny" = 595
Accepted values: "nx" 256 to 1920, "ny" 256 to 1920
This parameter specifies the size of the forecast map. "nx" specifies the width and "ny" the height.
For example Santiago, Chile:
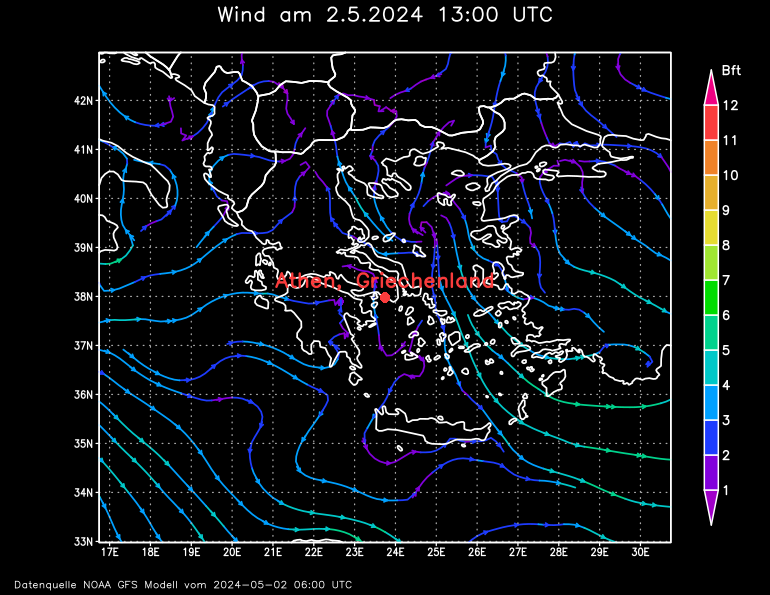
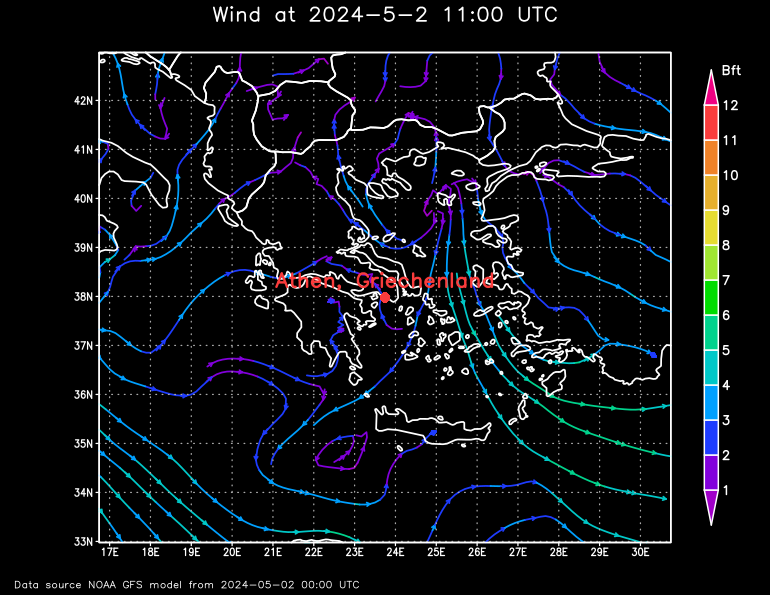
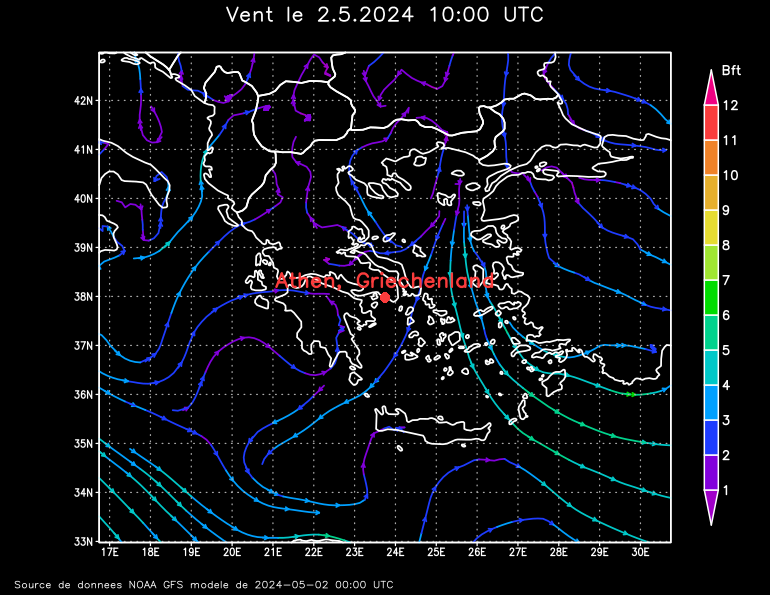
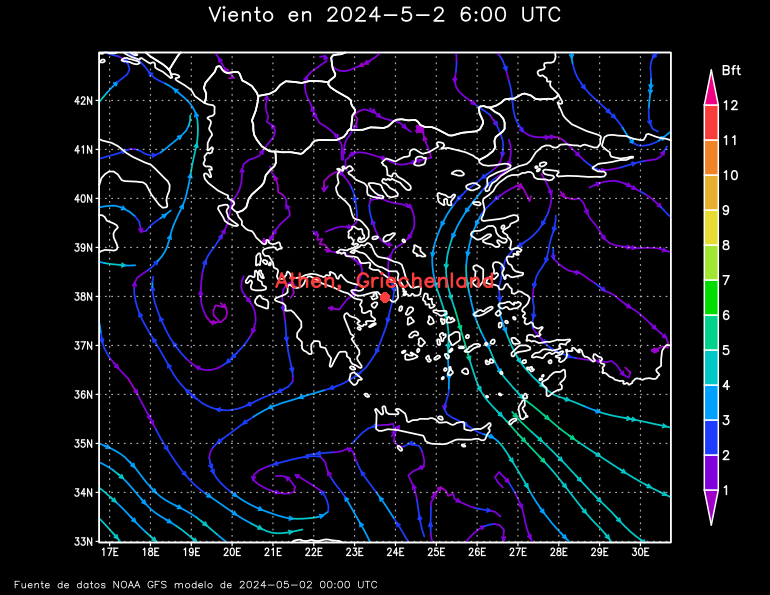
Parameter "lang"
Standard value: "lang" = de
Accepted values: de, en, fr, es
This parameter specifies the language of the labeling on the meteogram:
- de = German
- en = English
- fr = French
- es = Spanish
For example Athen, Griechenland:
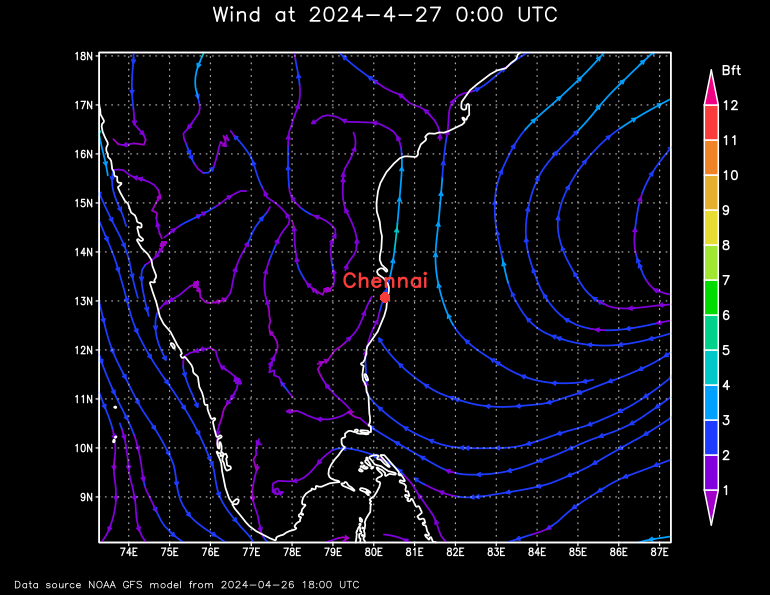
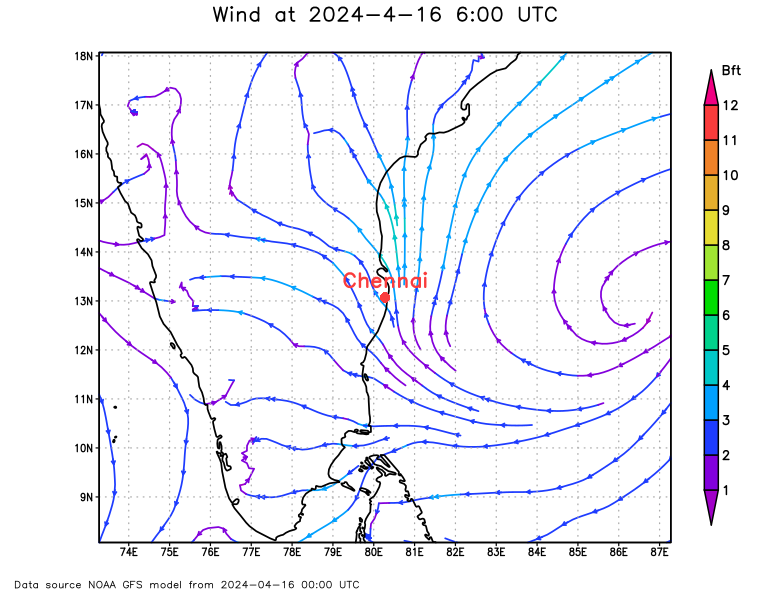
Parameter "backgroundColor"
Standard value: "backgroundColor" = black
Accepted values:
| Color | RGB color code | value |
|---|---|---|
| 0, 0, 0 | black | |
| 255,255,255 | white |
The parameter "backgroundColor" specifes the background color of the forecast map.
For example Chennai, Indien:
Parameter "mapColor"
Standard value: "mapColor" = white
Accepted values:
| color | RGB color code | value |
|---|---|---|
| 0, 0, 0 | black (value "black" causes the opposide of the background, if the background is black, value "black" causes a white map!!!) | |
| 255,255,255 | white (value "white" causes the same as the background, if the background is black, value "white" causes a white map, invisible map!!!) | |
| 160, 0, 200 | purple | |
| 130, 0, 220 | darkPurple | |
| 30, 60, 255 | darkBlue | |
| 0, 160, 255 | mediumBlue | |
| 0, 200, 200 | lightBlue | |
| 0, 210, 140 | aqua | |
| 0, 220, 0 | green | |
| 160, 230, 50 | yellowGreen | |
| 230, 220, 50 | yellow | |
| 230, 175, 45 | darkYellow | |
| 240, 130, 40 | orange | |
| 250, 60, 60 | red | |
| 240, 0, 130 | magenta | |
| 170, 170, 170 | gray |
The parameter "mapColor" specifies the color for the contours of the landscapes.
For example cape north:
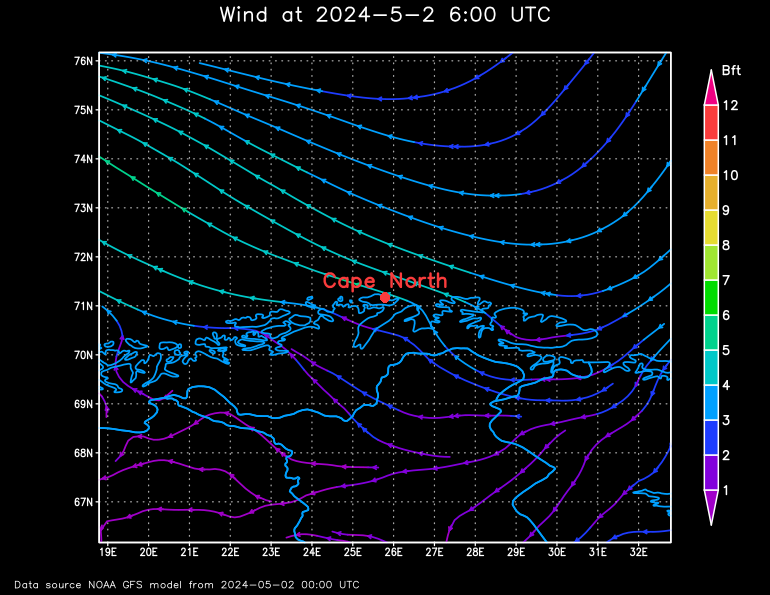
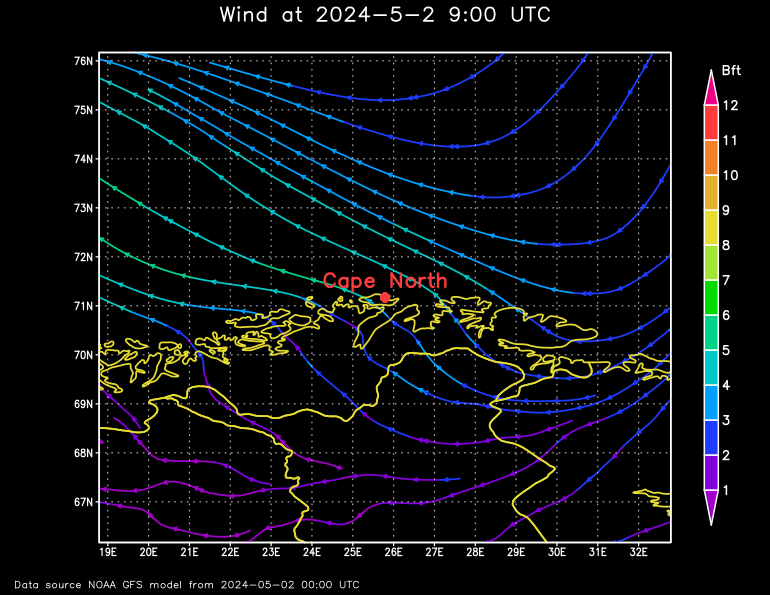
Parameter "labelColor"
Standard value: "labelColor" = red
Accepted values:
| Farbe | RGB Farbcode | Wert |
|---|---|---|
| 0, 0, 0 | black | |
| 255,255,255 | white | |
| 160, 0, 200 | purple | |
| 130, 0, 220 | darkPurple | |
| 30, 60, 255 | darkBlue | |
| 0, 160, 255 | mediumBlue | |
| 0, 200, 200 | lightBlue | |
| 0, 210, 140 | aqua | |
| 0, 220, 0 | green | |
| 160, 230, 50 | yellowGreen | |
| 230, 220, 50 | yellow | |
| 230, 175, 45 | darkYellow | |
| 240, 130, 40 | orange | |
| 250, 60, 60 | red | |
| 240, 0, 130 | magenta | |
| 170, 170, 170 | gray |
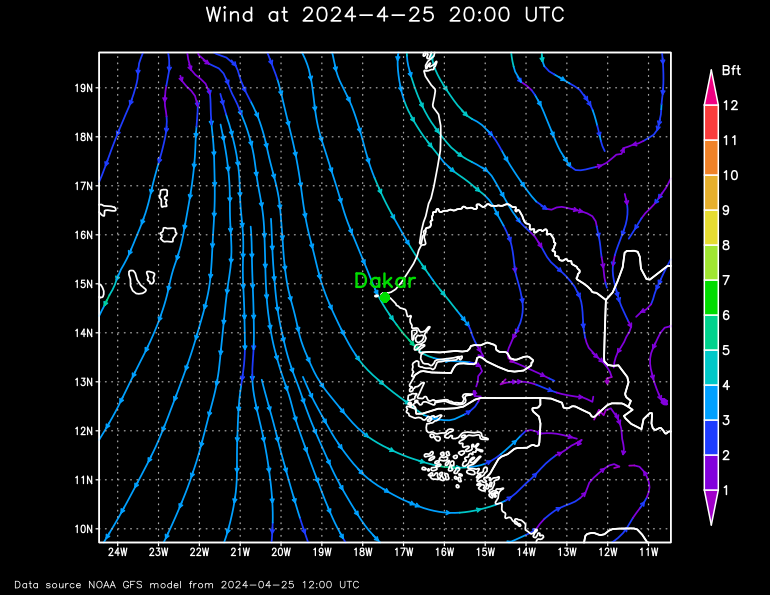
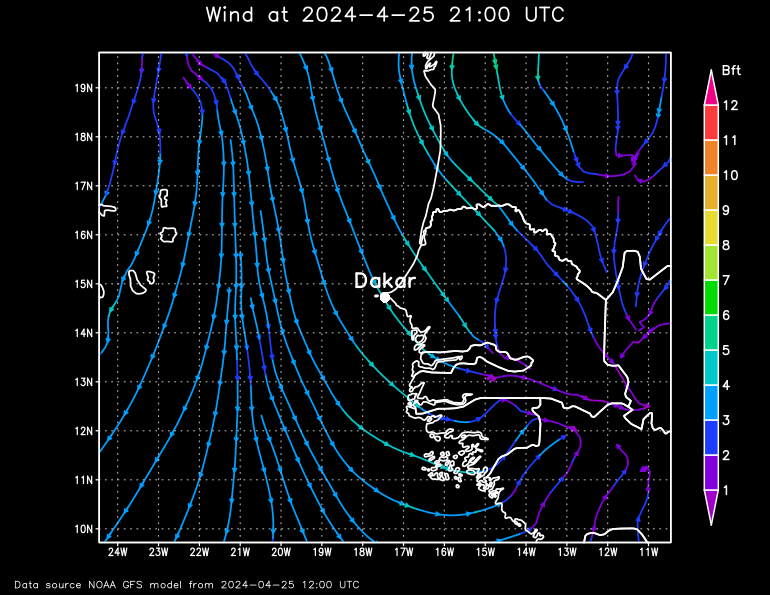
The parameter "labelColor" specifies the color of the label.
For example Dakar:
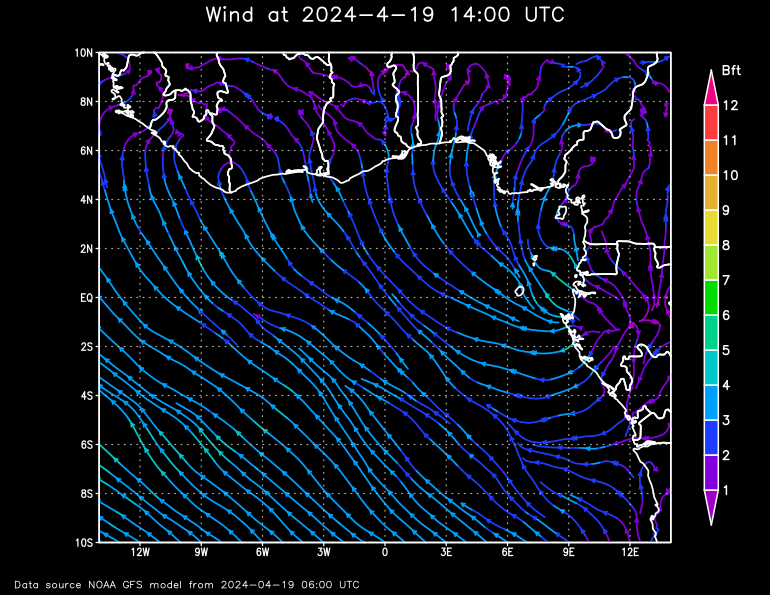
Parameter "scale"
Standard value: "scale" = fixed
Accepted values: fixed, variable
"scale" specifies how the shown parameter is scaled:
- fixed = the scale is fixed (e.g. wind speed 1-12 BFT). A disadvantage is the inaccurancy if there are only small values in the forecast area, an advantage is the comparability as same colors mean same values at different forecast maps.
- variable = the scale is variable. The maximum is always the highest value in the forecast map. An advantage is the accurancy if there are only small values in the forecast area, a disadvantage are the different colors for the same values in different forecast maps.
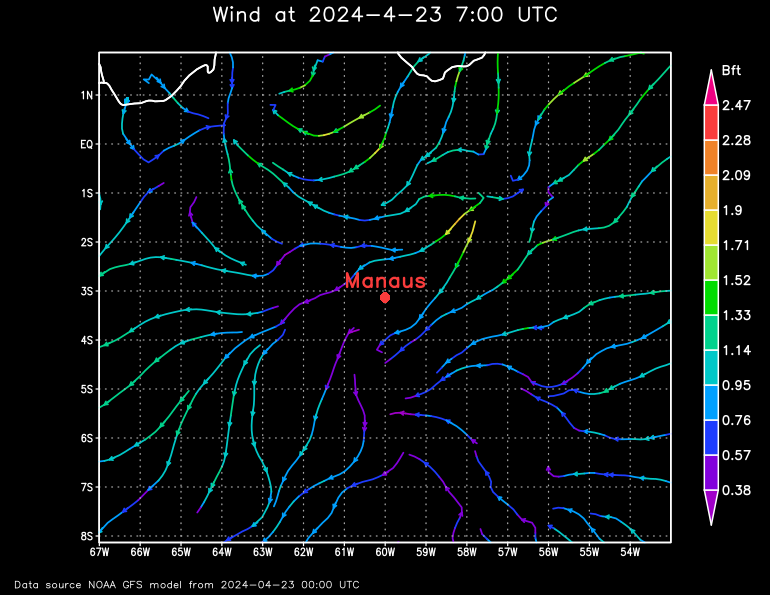
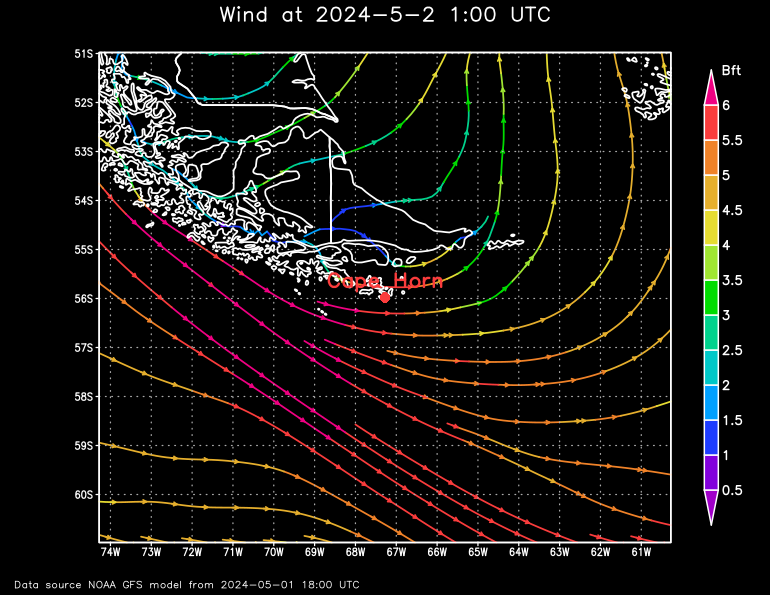
For example Manaus in the Amazonas and Cape Horn, island Homos:
You see immediately with "scale=fixed" in the comparasion, that the wind speed in the rain forest is slower then at Cape Horn, but it´s difficult to recognize the differences in the wind speed arounf Manaus.
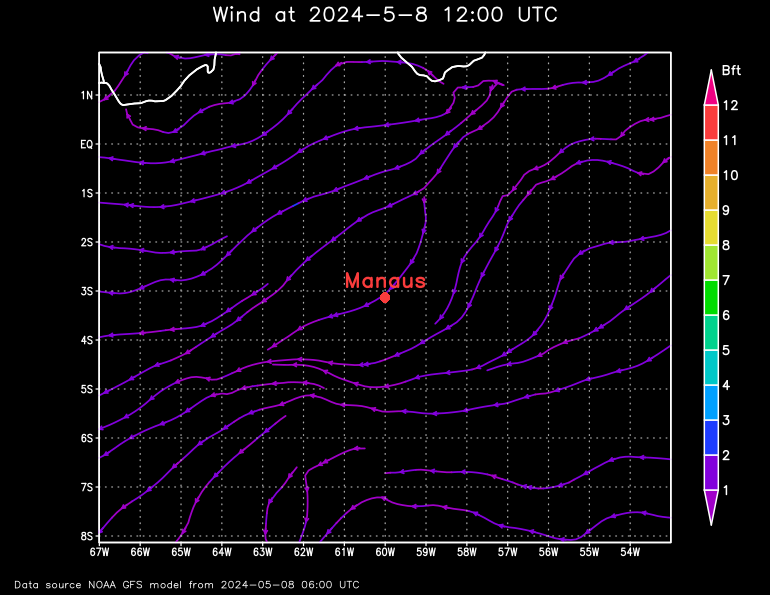
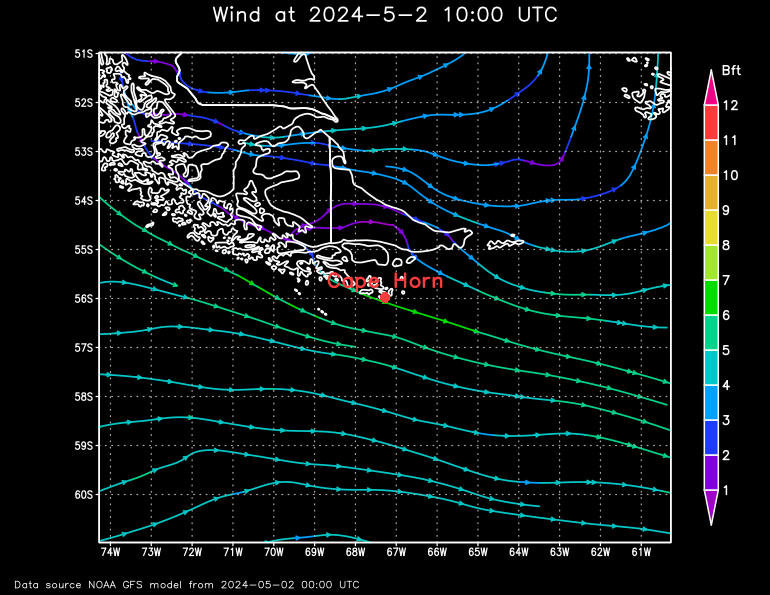
It´s easy to recognize the different wind speed within the particular forecast maps with "scale=variable", but it´s difficult to compare the values of the differend forecast maps.
Parameter "projection"
Standard value: "projection" = latlon
Accepted values: latlon, scaled, nps, sps, orthogr, mollweide, robinson
The parameter specifies which map projection will be used to display the weather map:
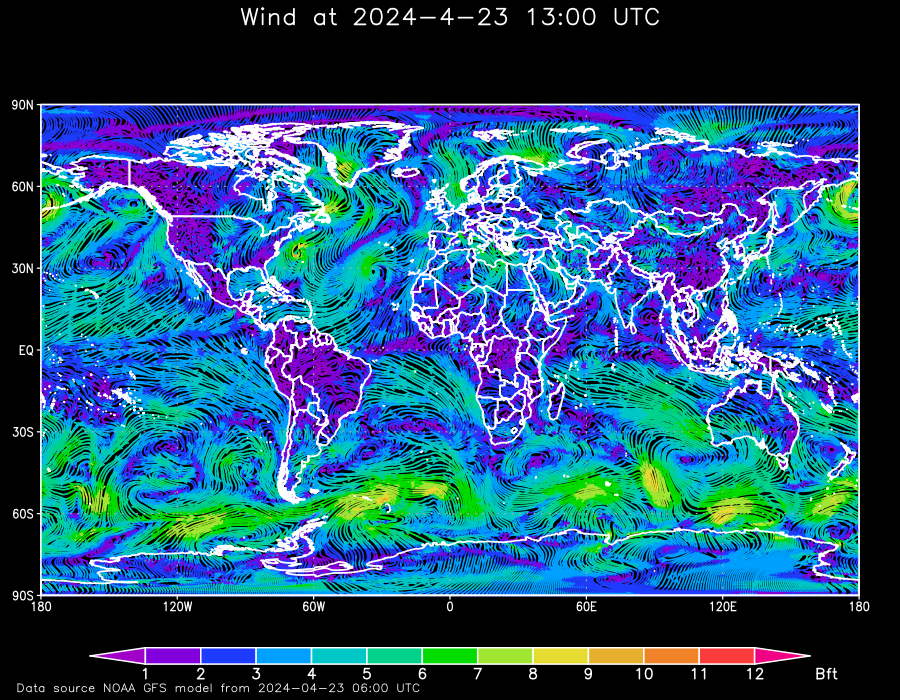
- latlon = The equirectangular projection (also called the equidistant cylindrical projection, geographic projection, or la carte parallélogrammatique projection, and which includes the special case of the plate carrée projection or geographic projection) is a simple map projection.
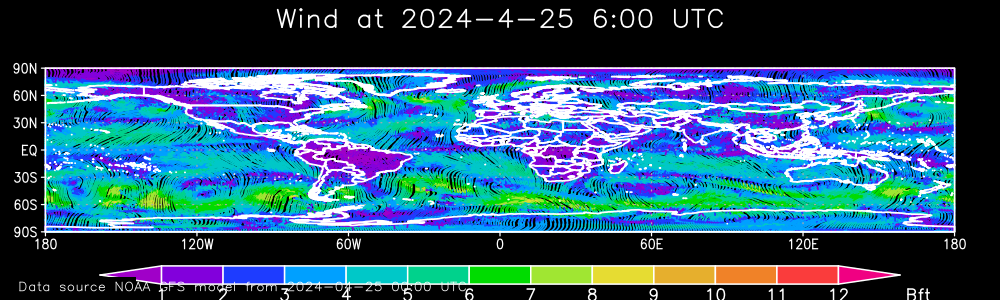
- scaled = In principle like the "latlon" projection, except the aspect ration is not maintained, it´s variable. The map is stretched to use the whole drawing area.
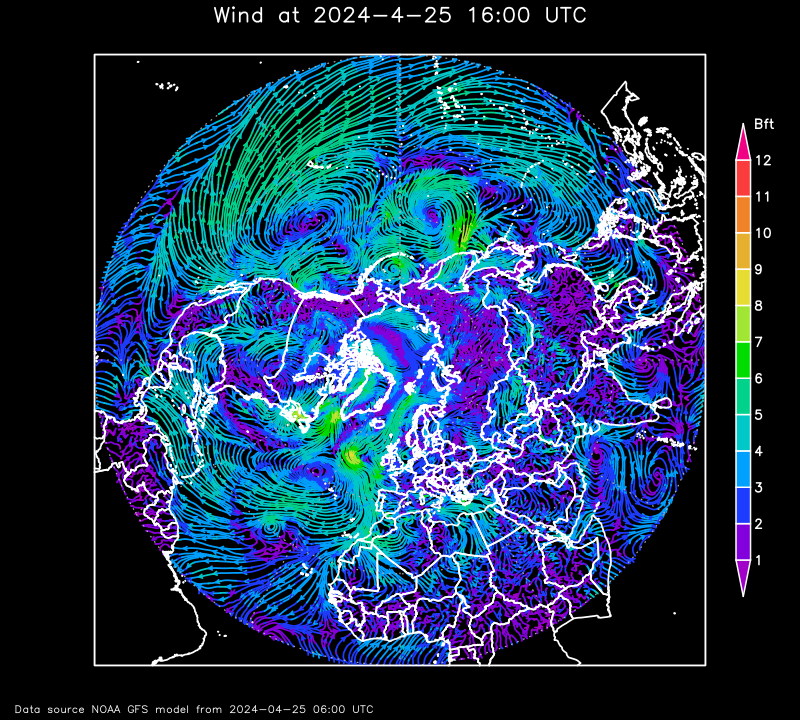
- nps = The azimuthal equidistant projection with view on the north pole is an azimuthal map projection. It has the useful properties that all points on the map are at proportionately correct distances from the center point, and that all points on the map are at the correct azimuth (direction) from the center point. A useful application for this type of projection is a polar projection which shows all meridians (lines of longitude) as straight, with distances from the pole represented correctly.
- sps = The azimuthal equidistant projection with view on the south pole is an azimuthal map projection. It has the useful properties that all points on the map are at proportionately correct distances from the center point, and that all points on the map are at the correct azimuth (direction) from the center point. A useful application for this type of projection is a polar projection which shows all meridians (lines of longitude) as straight, with distances from the pole represented correctly.
- orthogr = The use oforthographic projection in cartography dates back to antiquity. Like the stereographic projection and gnomonic projection, orthographic projection is a perspective (or azimuthal) projection, in which the sphere is projected onto a tangent plane or secant plane.
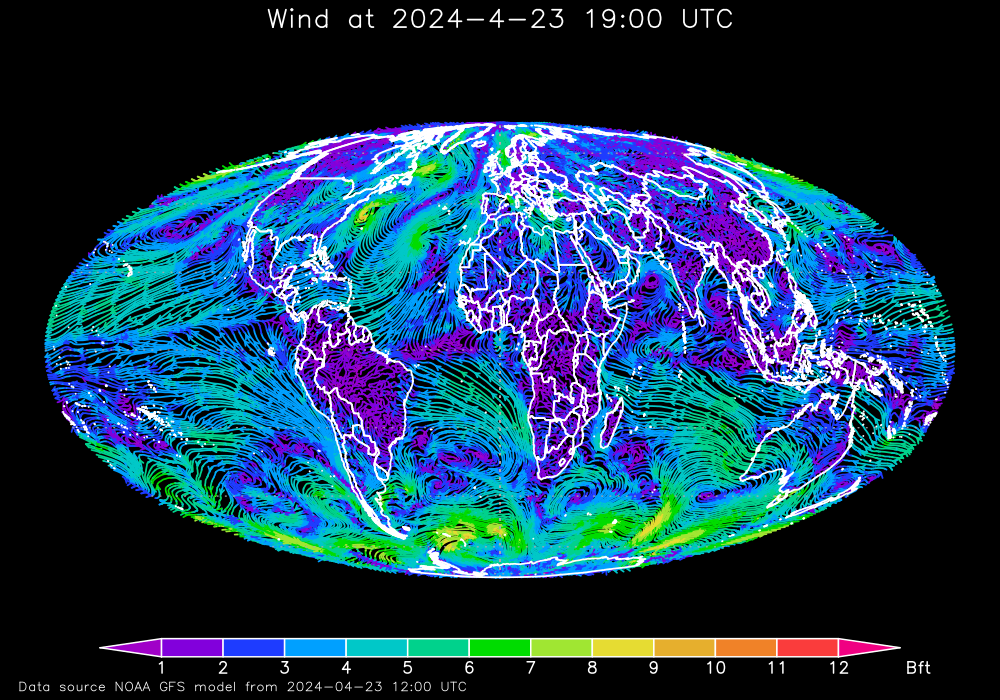
- mollweide = The Mollweide projection is an equal-area, pseudocylindrical map projection generally used for global maps of the world or night sky.
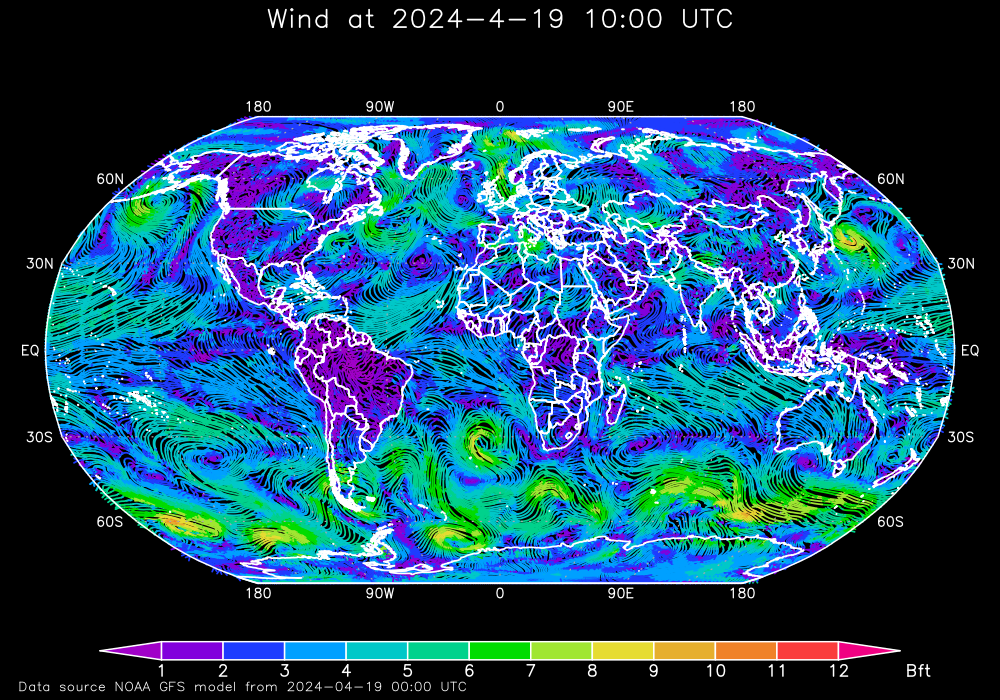
- robinson = The Robinson projection is a map projection of a world map which shows the entire world at once. It was specifically created in an attempt to find a good compromise to the problem of readily showing the whole globe as a flat image.
Now some examples to illustrate the different kinds of projections:
First the standard projection "latlon", the equirectangular projection. With this projection it´s possible to generate any details of the earth (see other examples above):
An example of "scaled". Also with this projection it´s possible to generate any details of the earth (see other examples above):
An example of "nps", a view on the north pole:
"lat" has to be between 45 and 90. "latRange" must be (90-lat)*2. With "lon" the map can be rotated around the center. "lon" has to be between -180 and 180. "lonRange" must be 360. Only considering this rules will produce resonable maps.
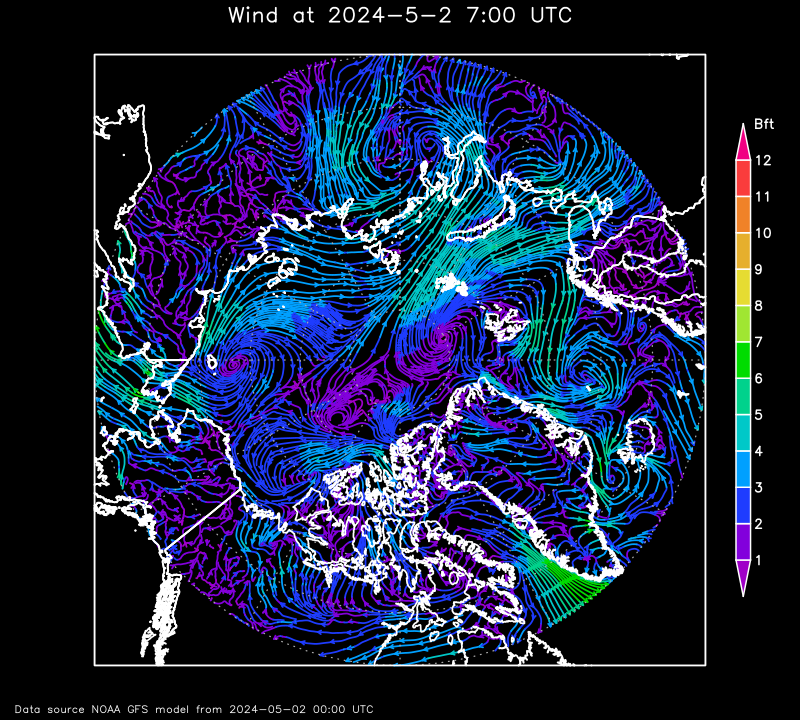
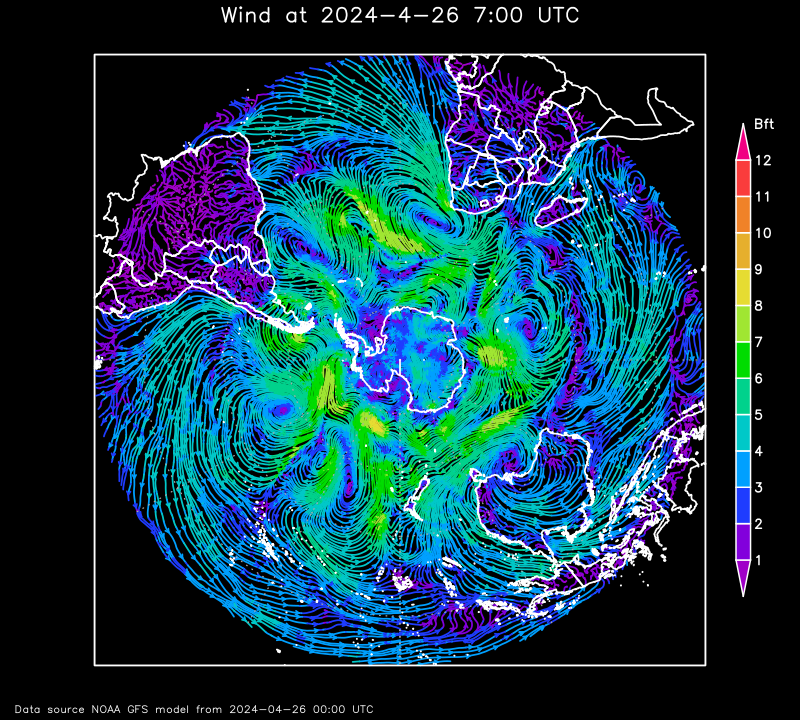
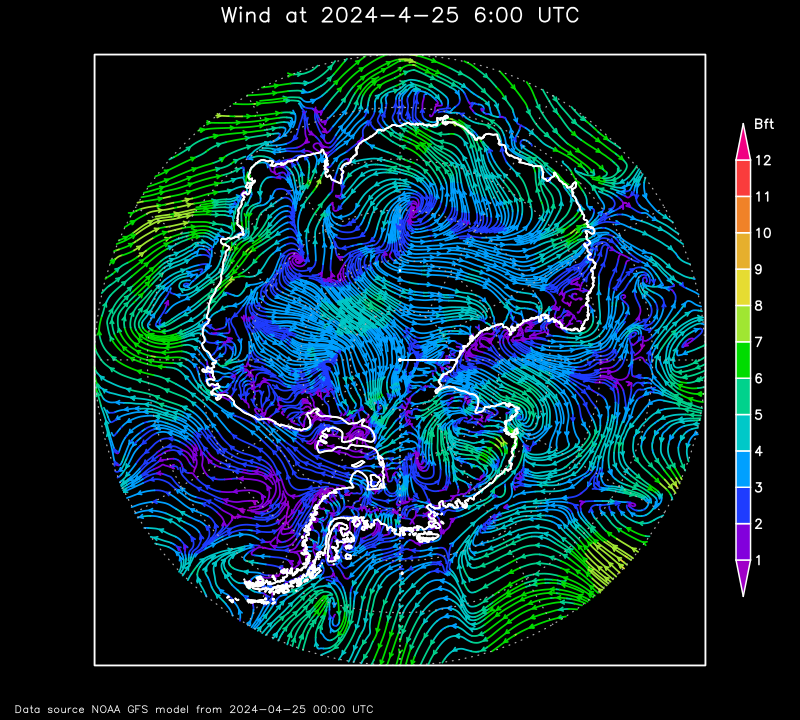
With "sps" it´s possible to look on the south pole:
"lat" has to be between -45 and -90. "latRange" must be (90-|lat|)*2. With "lon" the map can be rotated around the center. "lon" has to be between -180 and 180. "lonRange" must be 360. Only considering this rules will produce resonable maps.
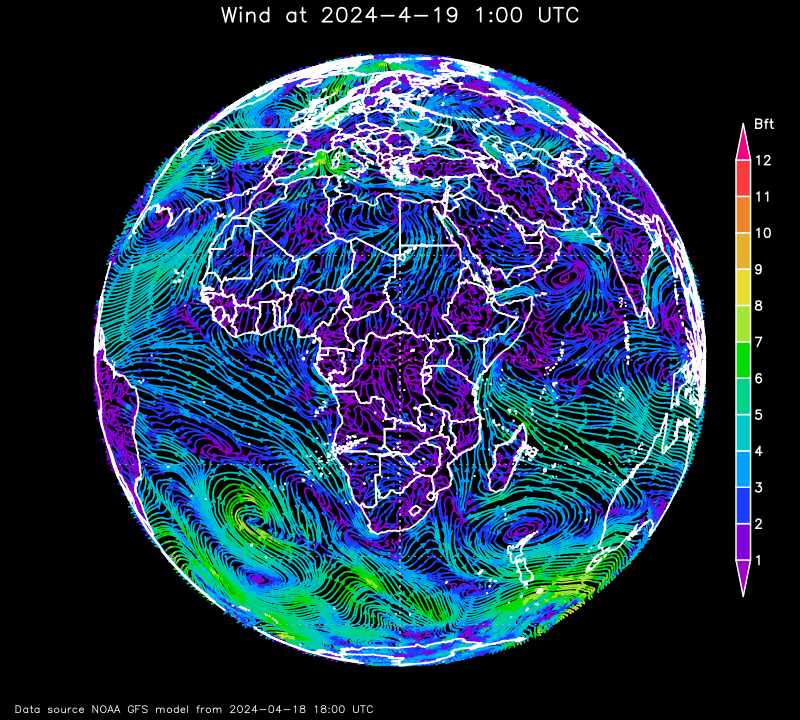
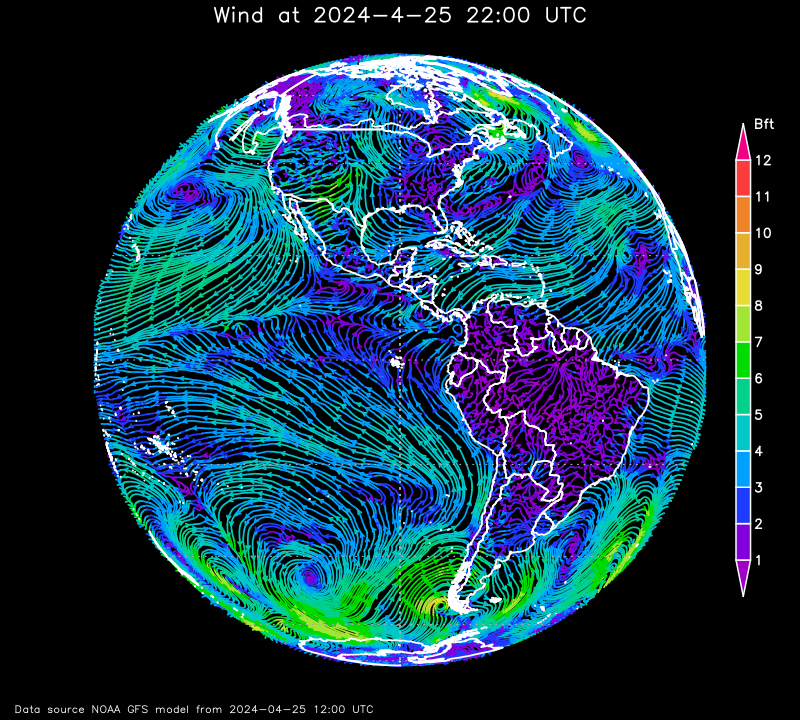
With "orthogr" it´s possible to look on the equator:
"lat" must be 0. "latRange" must be 180. With "lon" the map can be rotated around the poles. "lon" has to be between -180 and 180. "lonRange" must be 180. Only considering this rules will produce resonable maps.
With "mollweide" would map in mollweide projection will be generated:
"lat" must be 0. "latrange" must be 180. With "lon" the map can be rotated around the poles. "lon" has to be between -180 and 180. "lonRange" must be 180. Only considering this rules will produce resonable maps.
If "lon" is not equal 0, at the left and right side to much of the country contours will be drawn. The area of the weather data is absolutly correct.
With "robinson" a world map in robinson projection will be generated:
"lat" must be 0. "latRange" must be 180. With "lon" the map can be rotated around the poles. "lon" has to be between -180 and 180. "lonrange" must be 180. Only considering this rules will produce resonable maps.
If "lon" is not equal 0, at the left and right side to much of the country contours will be drawn. The area of the weather data is absolutly correct.
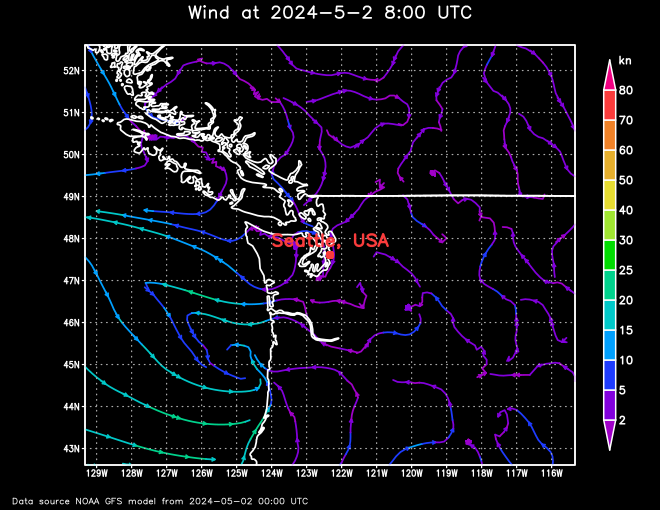
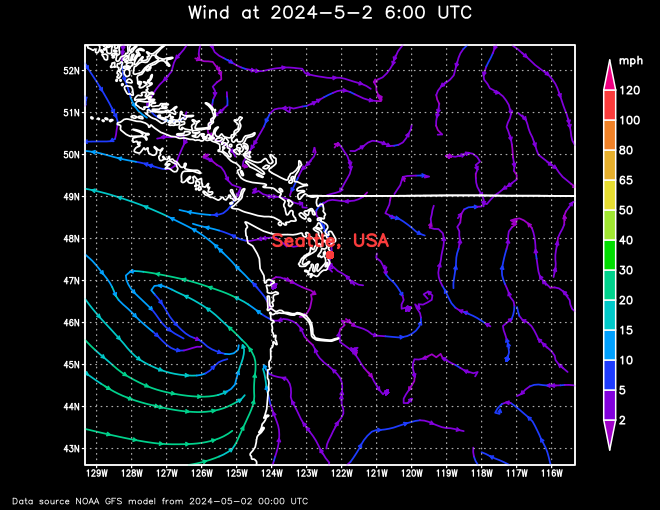
Parameter "unit"
The parameter "unit" specifies the unit of the values of the scale beside the diagram. If the unit parameter is not an accepted value, the standard value is used.
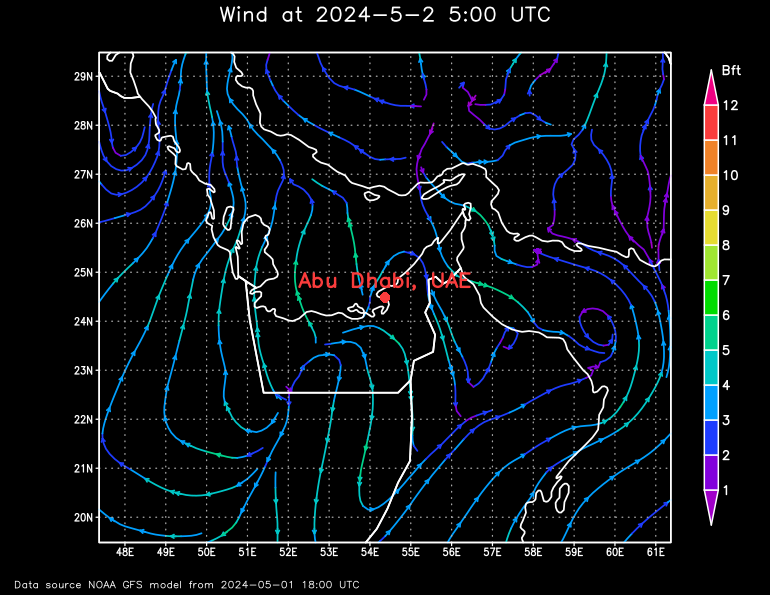
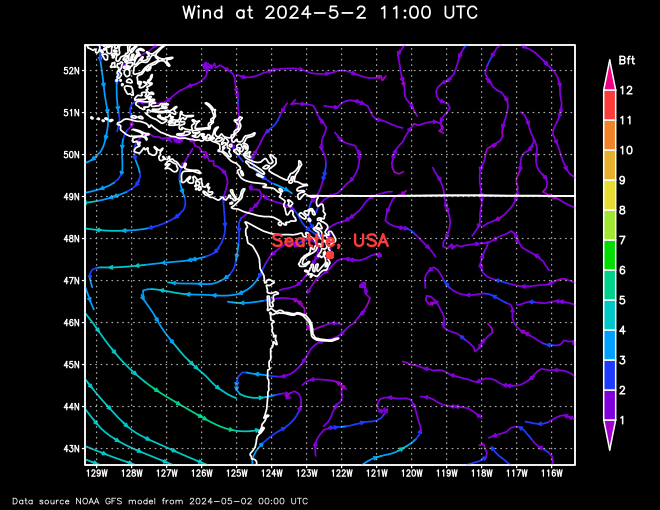
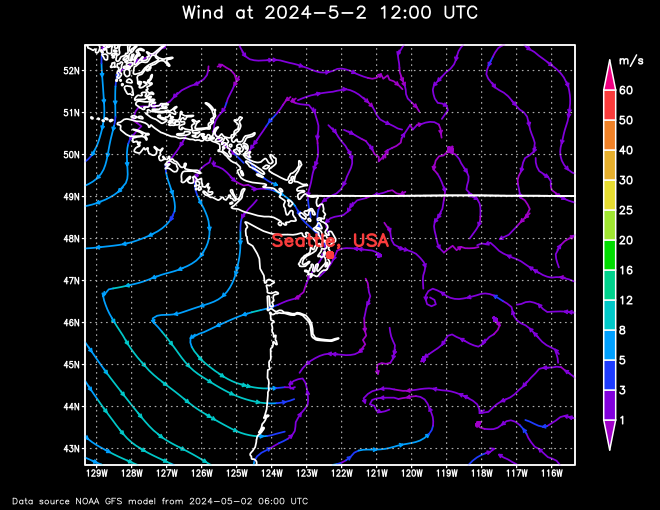
For variables "windStream" | "GFS_WIND_10m" | "GFS_WIND_10m_Stream", "windBarb" | "GFS_WIND_10m_Barb" or "windVector" | "GFS_WIND_10m_Vector" | "gust" | "GFS_GUST_10m" | "seaSurfaceCurrent" | "RTOFS_CURR_0m"
Standard value: "unit" = BFT
Accepted values: BFT, m/s, km/h, kn or mph
Beaufort (BFT), meters per second (m/s), kilometers per hour (km/h), miles per hour (mph).
For "airTemperature" | "GFS_TMP_2m" | "seaSurfaceTemperature" | "RTOFS_WTMP_0m"
Standard value: "unit" = C
Accepted values: C, F, K
degree Celsius (C), degree Fahrenheit (F), degree Kelvin (K).
For "surfacePressure" | "GFS_PRMSL_msl", all only in shaded mode
Standard value: "unit" = hPa
Accepted values: hPa, mbar, mmHg, inHg, Torr, psi
hektopascal (hPa), millibar (mbar), millimeter of mercury (mmhG), inch of mercury (inhG), Torr (Torr), pounds per square inch (psi)
For "precipitation" | "GFS_PRATE_0m", all only in shaded mode
Standard value: "unit" = mm/h
Accepted values: mm/h, in/h
millimeter per hour, equal to liter per squaremeter per hour (mm/h), inch per hour (in/h)
For "significant_wave_height" | "GFSWAVE_HTSGW_0m" | "primaryWaveHeightDirection" | "GFSWAVE_HTSGW_DIRPW_0m" | "windWaveHeightDirection" | "GFSWAVE_WVHGT_WVDIR_0m" | "swellHeightDirection" | "GFSWAVE_SWELL_SWDIR_0m_1" | "seaIceThickness" | "RTOFSICE_ICETK_0m"
Standard value: "unit" = m
Accepted values: m, ft
meter (m), feet (ft)
For "cloudCover" | "GFS_TCDC_atm" | "relativeHumidity" | GFS_RH_2m" | "seaIceCoverage" | "RTOFSICE_ICEC_0m"
Standard value: "unit" = %
As only "%" is a valid value, the unit parameter has no influence
For "primaryWavePeriod" | "GFSWAVE_PERPW_0m" | "windWavePeriod" | "GFSWAVE_WVPER_0m" | "swellPeriod" | "GFSWAVE_SWPER_0m_1"
Standard value: "unit" = s
As only "s" is a valid value, the unit parameter has no influence
For example wind_stream for Seattle, USA:

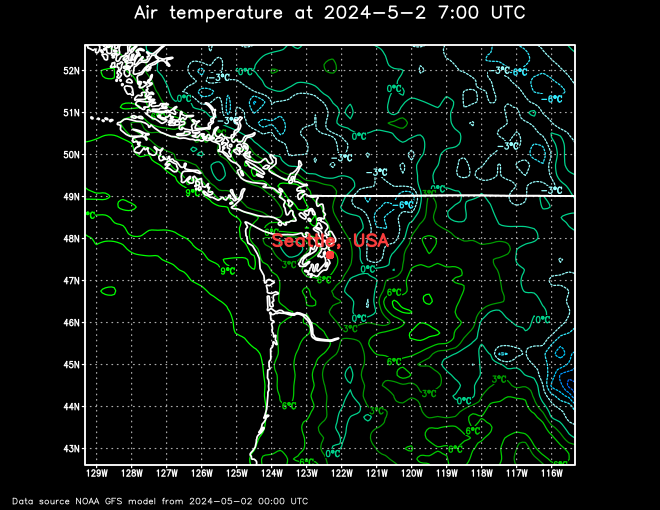
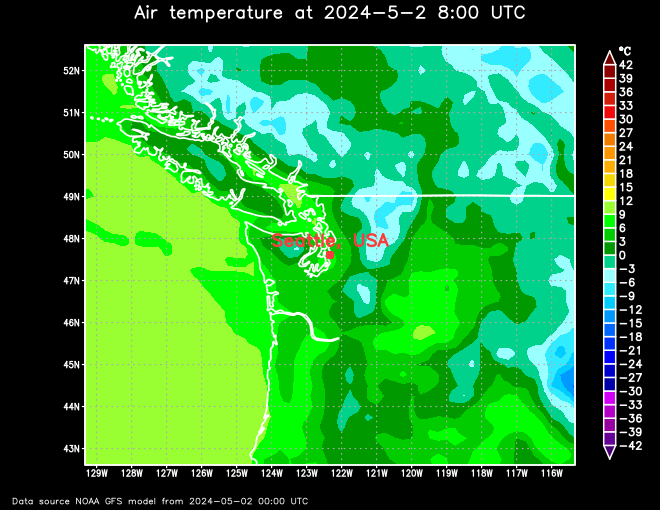
Parameter "displayType"
For variables "gust" | "GFS_GUST_10m" | "airTemperature" | "GFS_TMP_2m" | "surfacePressure" | "GFS_PRMSL_msl" | "cloudCover" | "GFS_TCDC_atm" | "relativeHumidity" | "GFS_RH_2m" | "precipitation" | "GFS_PRATE_0m" | "significantWaveHeight" | "GFSWAVE_HTSGW_0m" | "primaryWavePeriod" | "GFSWAVE_PERPW_0m" | "windWavePeriod" | "GFSWAVE_WVPER_0m" | "swellPeriod" | "GFSWAVE_SWPER_0m_1" | "seaSurfaceTemperature" | "RTOFS_WTMP_0m" | "seaIceCoverage" | "RTOFSICE_ICEC_0m" | "seaIceThickness" | "RTOFSICE_ICETK_0m"
Standard value: "display_type" = contour
Accepted values: contour or shaded
The parameter "displayType" specifies if the desired parameter is visualised in contours or shaded.
For example Seattle, USA: